The 1-hour chart
February 10, 2026
One timeframe, one chart. Everything I need to read a market lives on a single 1-hour TradingView layout, and every indicator on it earns its place by answering one specific question. This is the exact stack:
Technical setup
Vol (200)
EMA (20, close, 0, None, 14, 2)
EMA (50, close, 0, None, 14, 2)
EMA (200, close, 0, None, 14, 2)
Pivots (Traditional)
VRVP (Number Of Rows, 30, Up/Down, 70)
Stoch (14, 1, 3)
Stoch (40, 1, 3)
Stoch (60, 10, 1)
OBV (EMA, 200, 2)
Fundamental setup
- Earnings
- Revenue one year growth %
- Inst Own Finviz
- Short Float Finviz
- Short Ratio Finviz
- Free Float
- Cash Runway & Solvency Pine Script
- Insider Trading Finviz
- Book Value & Tangible Book Value Pine Script
Technicals
Trend — the three EMAs
The 20, 50, and 200 EMAs answer the first question: which way is the water flowing? The 20 tracks the immediate move, the 50 the swing, the 200 the tide. Their order and spacing tell the story at a glance — stacked and fanning apart means a trend with room to breathe; braided together means chop, and chop means patience.
Volume — Vol, VRVP, and OBV
Price says what happened; volume says whether to believe it. The plain volume bars (200-period average) flag conviction on individual candles. VRVP — the volume profile — shows where the fighting happened: the high-volume nodes that act as magnets and the low-volume pockets price slips through quickly. OBV with a 200-period EMA smoothing answers the quieter question of whether money is accumulating or distributing while price goes sideways.
Momentum — three stochastics, three speeds
Three stochastics at 14, 40, and 60 are the same instrument tuned to three tempos — fast, swing, and slow. When all three agree, momentum is unambiguous. When the fast one turns against the slow ones, it is usually noise; when the slow one turns, it is usually news.
The chart — full layout on MSFT
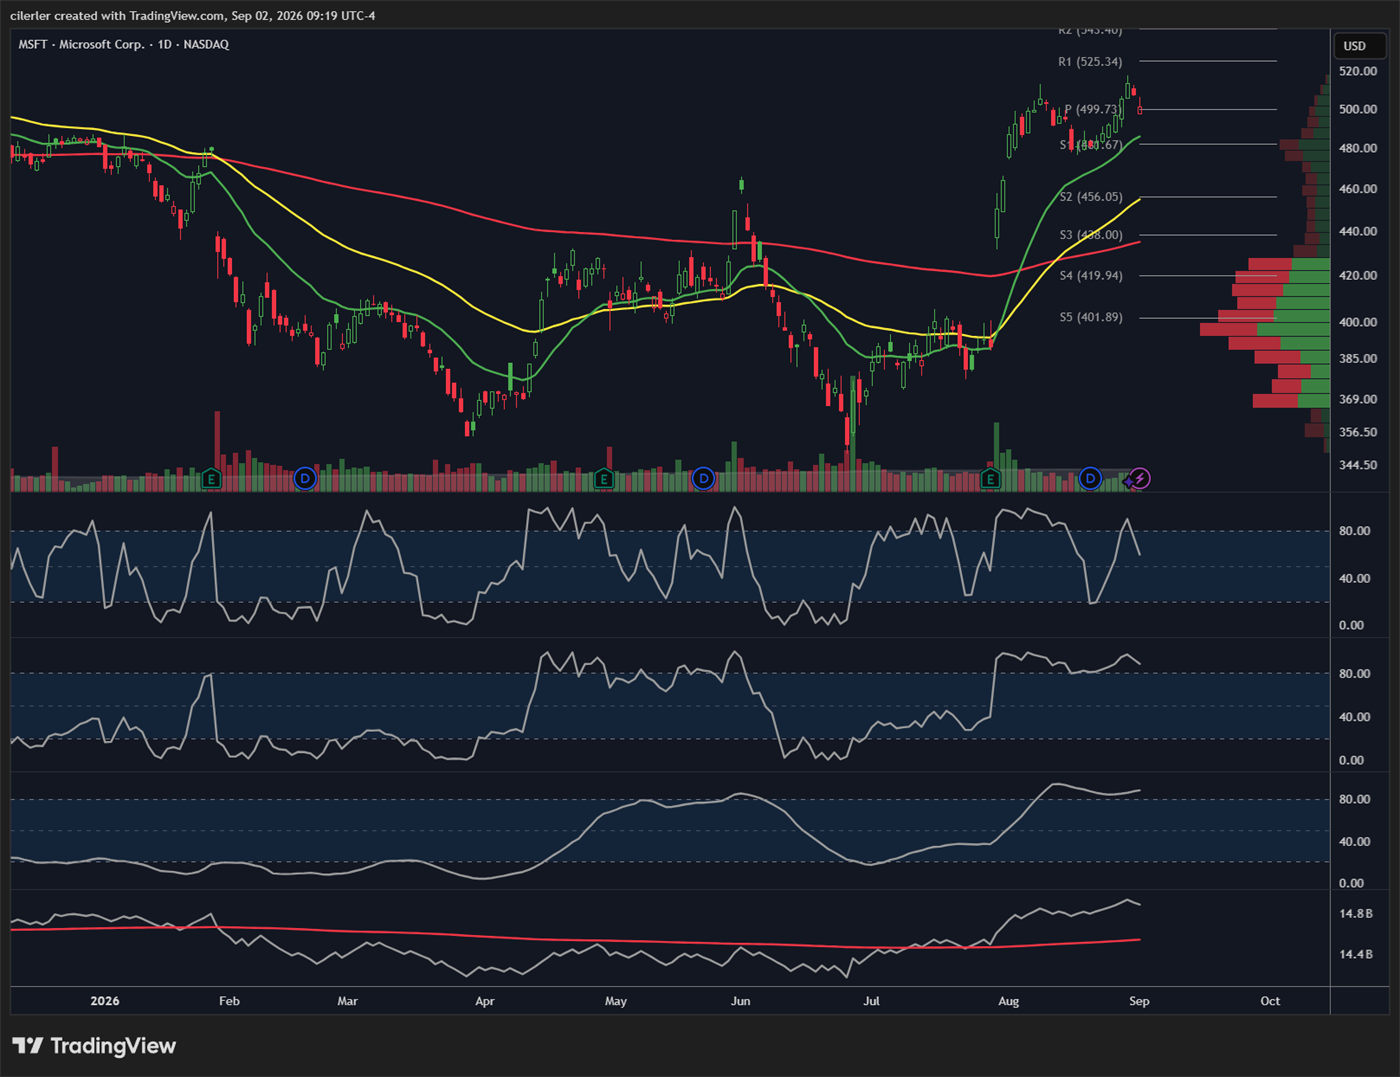
The full stack on MSFT, 1-hour chart.
Fundamentals
The chart shows the technical structure, but not who is trapped, what the business is backed by, or what calendar risks are looming.
Tip
TradingView does not provide short interest, institutional ownership, or insider transaction data directly on the chart, making Finviz the off-chart complement to gather this data.
Earnings date — event risk filter
Technical setups only work when price discovery is continuous. Earnings reports are binary catalysts that ignore technical levels, gap across stop-losses, and instantly invalidate 1-hour chart structure. Checking the earnings calendar ensures a clean technical swing is never blindsided by scheduled event risk.
Revenue growth — the institutional trend engine
Is big money accumulating behind the move? A breakout on the chart requires continuous institutional buying to sustain a multi-week trend. Accelerating quarterly revenue growth (YoY) attracts algorithmic accumulation that respects the 20 and 50 EMAs, while revenue-less breakouts frequently end in exhaustion traps and sharp mean-reversions.
Institutional ownership % — tape quality & follow-through Finviz
Who controls the order book? Stocks with heavy institutional sponsorship (70%+ institutional ownership) are traded by algorithms that systematically defend the 20 and 50 EMAs, creating clean trend pullbacks and reliable technical structure. Low institutional ownership (under 20–30%) signals a retail-dominated tape prone to erratic wicks, thin liquidity pockets, and false breakouts.
Short interest — squeeze mechanics Finviz
Price action alone cannot reveal short positioning or squeeze mechanics. Two metrics measure the vulnerability of short sellers:
- Short Float % — how crowded is the short side? High short float is potential squeeze fuel. When price breaks out on volume, trapped shorts scrambling to cover turn into forced buyers.
- Short Ratio (Days to Cover) — how narrow is the exit door? The number of days of average volume required to buy back and close all open short positions. The higher the number, the harder it is for shorts to escape without driving price sharply higher.
Free float — market velocity & volatility
How fast will the candles move? Free float sets the speed limit of price discovery. A low float (under 10–20 million shares) moves like a rocket — candle ranges expand rapidly, spreads widen, and slippage increases. A multi-billion share mega-cap moves like an aircraft carrier. Checking free float tells how aggressively to size positions and how wide stops must be to survive normal 1-hour noise.
Cash runway & dilution risk — the small-cap trap Pine Script
Will management dump shares into the technical spike? For small and mid-caps, the primary risk to a squeeze or breakout is an overnight secondary offering or shelf registration (S-3/ATM). If cash runway is under 6 to 12 months, management will frequently sell into liquidity spikes, killing the rally instantly. Low runway means taking profits fast rather than holding for extended swing targets.
TradingView Pine Script — Cash Runway & Solvency
// Copyright (c) 2026 Cengiz Ilerler
// This Pine Script™ code is subject to the terms of the Mozilla Public License 2.0 at https://mozilla.org/MPL/2.0/.
//
// Cash Runway & Solvency
// Estimates how many quarters of cash a company has left at its current operating burn rate,
// from reported quarterly cash and cash flow from operating activities.

//@version=6
indicator("Cash Runway & Solvency", overlay=false)

// Fetch quarterly balance sheet and cash flow data
cash = request.financial(syminfo.tickerid, "CASH_N_EQUIVALENTS", "FQ", ignore_invalid_symbol=true)
ocf  = request.financial(syminfo.tickerid, "CASH_F_OPERATING_ACTIVITIES", "FQ", ignore_invalid_symbol=true)

// Forward-fill quarterly data across bars
var float lastCash = na
var float lastOcf  = na

if not na(cash)
    lastCash := cash
if not na(ocf)
    lastOcf := ocf

// Determine state: Cash burning vs Profitable
isProfitable = not na(lastOcf) and lastOcf >= 0
cashBurn     = (not na(lastOcf) and lastOcf < 0) ? -lastOcf : na

// Calculate runway in quarters (capped at 20 for visual scaling)
float runway = na
if isProfitable
    runway := 20.0
else if not na(cashBurn) and cashBurn > 0 and not na(lastCash)
    runway := math.min(lastCash / cashBurn, 20.0)

// Plot runway line with dynamic color
plotColor = isProfitable ? color.teal : (runway < 2.0 ? color.red : (runway < 4.0 ? color.orange : color.blue))
plot(runway, "Runway (Quarters)", color=plotColor, linewidth=2, style=plot.style_stepline)

// Threshold benchmark lines
hline(20, "Profitable / Self-Funding (No Burn)", color=color.teal, linestyle=hline.style_dotted)
hline(4, "1-Year Safe Baseline (4Q)", color=color.green, linestyle=hline.style_dashed)
hline(2, "6-Month Critical Zone (2Q)", color=color.red, linestyle=hline.style_dashed)
Note
The script pulls quarterly (
"FQ") balance sheet data standard for US SEC filers. Foreign issuers and ADRs that report semi-annually may returnnauntil their periodic financial statements are published.
Insider trading — tracking the buys Finviz
What are the people with the keys doing with their own money? Insiders sell shares for countless non-operational reasons — taxes, diversification, estate planning, or personal liquidity. But they buy on the open market for only one reason: they believe the stock is undervalued and going higher. Tracking cluster insider buying via Finviz confirms whether executive conviction aligns with a technical bottom or breakout.
Book value & tangible book value Pine Script
Book value measures the net accounting value of the company divided across its common shares:
BVPS = (Total Assets − Total Liabilities) / Total Common Shares Outstanding
What is the hard asset floor per share? Comparing current market price directly to book value per share shows how much tangible equity sits underneath the candles:
- Asset-heavy vs. asset-light: Book value provides a meaningful floor for asset-rich, industrial, or turnaround candidates. For software and intellectual-property businesses, market prices naturally float well above book value without signaling overvaluation.
- Tangible value: Stripping away goodwill and unamortized intangibles leaves tangible book value—the true liquidation baseline when evaluating deep value or distress.
TradingView Pine Script — Book Value & Tangible Book Value
// Copyright (c) 2026 Cengiz Ilerler
// This Pine Script™ code is subject to the terms of the Mozilla Public License 2.0 at https://mozilla.org/MPL/2.0/.
//
// Book Value & Tangible Book Value
// Plots reported book value per share and tangible book value per share as stepped series.

//@version=6
indicator("Book Value & Tangible Book Value", overlay=false)

// Pull actual reported quarterly balance sheet figures
bvps  = request.financial(syminfo.tickerid, "BOOK_VALUE_PER_SHARE", "FQ", ignore_invalid_symbol=true)
tbvps = request.financial(syminfo.tickerid, "BOOK_TANGIBLE_PER_SHARE", "FQ", ignore_invalid_symbol=true)

// Plot both lines on the same pane
plot(bvps, "Total Book Value / Share", color=color.aqua, linewidth=2, style=plot.style_stepline_diamond)
plot(tbvps, "Tangible Book Value / Share", color=color.orange, linewidth=2, style=plot.style_stepline_diamond)
Note
Like cash runway, book value data relies on quarterly (
"FQ") financial reporting. For foreign securities that report half-yearly, balance sheet figures will step forward on semi-annual intervals.
These are notes on my own screen, not a recommendation. Markets take money from people who borrow other people’s setups without knowing why each piece is there.